RF Power meters and modulation percentage calculations
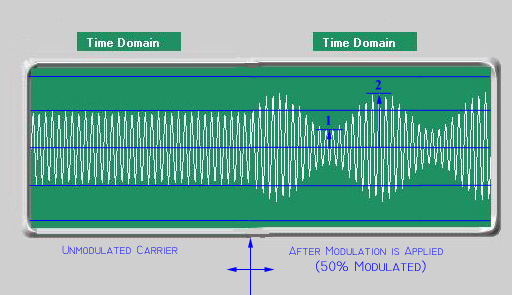
The graphic above shows an unmodulated carrier on the left side and a carrier being modulated to 50% by a pure sinewave on the right side.
The oscilloscope is probably the best and most accurate tool for making modulation measurements.
The reasons why the oscilloscope is the best tool for making modulation percentage measurements are many. The most obvious is that meter movements are not fast enough to track human speech. The other reasons are more subtle. The modulation percentage can be more complex than we initially consider it to be. For example, let's say we're measuring the modulation percentage of a transmitter whose modulation is unsymmetrical. What do we do?
First, let's figure out how to measure modulation percentage using a symmetrically modulated signal. The graphic above can help us with that. We know that at 100% modulation the voltage will double at the positive modulation peaks, and that the voltage will decrease to zero at the negative modulation valleys. We can adjust the scope to where the unmodulated carrier takes up exactly 4 vertical divisions. Each division is divided into 5 parts at the vertical center-line. Therefore, when modulation is added, each of the 10 sub-divisions between the carrier voltage (zero percent modulation) and double the carrier voltage (100% modulation) is equal to a 10% increase in the measured modulation percentage. The same is true when considering the negative modulation swings except that the carrier voltage decreases with increasing modulation percentage. What's important to remember is that for symmetrical modulation the positive modulation swings should increase the carrier voltage exactly the same amount as the negative modulation swings are decreasing it.
Now, let's get back to our problem of how to measure modulation percentage when the modulation is unsymmetrical.
There are three ways to handle this situation: The best way is to measure both the positive and negative modulation percentages and treat them equally. Another method is to average out the two modulation measurements. Doing so is a compromise, and is only used when a single modulation percentage figure is required. The third method is to only measure the positive modulation. To many, it's the positive modulation percentage that's most important. Any transmitter can acheive 100% negative modulation; however, many can not acheive 100% positive modulation. On the other hand, certain transmitters can acheive positive modulation percentages well in excess of 100%. Many people like to quote large positive modulation percentage figures. Since the negative modulation percentage can never be higher than 100%, averaging the large positive modulation figure with the maximum possible negative modulation percentage of 100 lowers the modulation percentage figure and lessens the impact of their statements.
Now that we understand positive and negative modulation, we can move on to the most controversial area of power measurement: using power meters to measure RF power.
Right at the start you should know that NOT ONE of the current crop of popular RF power meters is totally accurate. That's unbelieveable isn't it? Well, it's true. Even the ones that are considered standards in the industry such as Bird and Coaxial Dynamics fall short when comparing them to the measurements made using a scope and a spectrum analyzer.
It's WELL outside the scope of this tutorial to get into the reasons why power meters don't agree with the measurements made with a scope and spectrum analyzer. What I'll attempt to do here is give you an idea of how the meter measurements compare with the scope and spectrum analyzer measurements, and skim the surface as to the reasons why.
The most common type of RF power meter is the "average-reading" meter. For our purposes RMS and average are the same. There are meters that are "peak-reading" meters as well. Those are sub-divided into two catagories: powered, peak-reading meters; and unpowered (aka pseudo) peak-reading meters. Remember, all these meters are inaccurate in one way or another; some are more inaccurate than others.
Before we continue, we should look at how the average (or RMS) measurement is made.
If you'll recall, when modulation is added to a carrier the peak envelope voltage increases and decreases by the same amount. For example, a CB that produces a 4 watt carrier will have a peak envelope voltage of 20. At 100% positive and negative modulation the peak envelope voltages will be 40 and zero respectively. Averaging those two voltage measurements brings us right back where we started at 20 volts. Do you see what happened? As far as our measurements are concerned, the AVERAGE wattage doesn't change when modulation is added as long as the positive and negative modulation swings are equal and opposite. That's how average and RMS reading meters work. They are average-reading VOLTMETERS that read out in average or RMS watts. In other words, the positive and negative modulation swings cancel each other out resulting in an average wattage reading.
This brings up an interesting point: What happens when the positive and negative modulation swings are not equal and opposite (aka unsymmetrical modulation)? The answer is that as modulation is added the meter reading will swing toward the dominant modulation type. For example, let's say we have a CB whose carrier is set to 6 watts. Let's say that this particular radio can acheive 100% negative modulation, but can only acheive 50% positive modulation. When modulation is added there is a net LOSS of average power because the negative modulation swings decrease the carrier power more than the positive modulation swings are increasing it. An average-reading meter will show the net loss in average output when modulation is added. This type of situation is very common in CB radio. Decreasing average power when modulation is added is commonly known as "backward swing." It happens when the carrier (dead-key) wattage is increased too much. In that situation there isn't enough audio power to symmetrically modulate the carrier. It also happens when the carrier drive to an amplifier is too high.
The opposite (forward swing) can also happen. When the positive modulation swings increase the carrier voltage more than the negative modulations swings are decreasing it, there is a net increase in average wattage.
This information can be helpful when evaluating an A.M. transmitter using an average-reading meter. When the modulation is symmetrical (which is the ideal situation) the wattage reading will not change at any modulation percentage.
Now, getting back to the different meter types; the peak-reading meters attempt to read the peak envelope voltage and read out in peak envelope power. The ones that have powered peak-detector circuits are more accurate at reading peaks that those that use a simple unpowered circuit.
There are some interesting mathmatic relationships when using a meter or a scope for RF power measurements that you should be aware of:
The classic equation relating peak wattage to carrier wattage at 100% symmetrical modulation is 4 to 1. For example, a CB radio that has a carrier wattage of 4 and can acheive 100% positive modulation will have a peak wattage of 16. When using the common wattmeters available today, that relationship is usually 3 to 1 rather than 4 to 1. For example, the same CB that showed 16 peak watts using a scope will show 12 using a meter (assuming the meter showed the carrier wattage as 4).
Also, another classic equation shows the average wattage increasing by 50% when 100% modulated. That increase comes from the additional sideband energy that's created when the modulating audio is applied to the carrier. Modern average-reading meters, and even oscilloscopes, won't detect the additional sideband energy; it's only seen on the spectrum analyzer. Here's an example: Our 4 watt CB's average output should increase to 6 watts at 100% modulation due to the additional sideband energy that it's output signal contains. The scope shows the peak wattage as 16 and the average wattage as 4. A good peak-reading meter will show the peak wattage as 16 and the average wattage as 5.33. A good average-reading meter will show the average wattage as 4. Other meters, depending on their design and adjustment could show anything from 2 watts to 20 watts or more. The spectrum analyzer will show the 4 watt carrier and two 1 watt sidebands that add up to a total composite signal output of 6 watts.
Confusing isn't it? That's how it is with RF power and the instruments we use to measure it.
The main point here is that there is no one single instrument that's best or totally accurate when measuring RF power. The two best instruments for measuring RF power are the ones seen in the graphics; the oscilloscope and the spectrum analyzer.
Well, that about wraps it up. I hope you enjoyed this little tour of amplitude modulation.
